
MANIFOLD APPLICATION
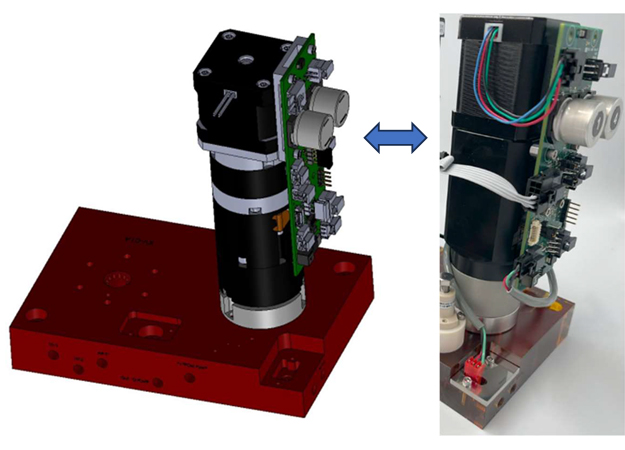 A valve on a manifold typically refers to a valve that is integrated or mounted on a manifold system. A manifold is a component that serves as a central hub or distribution point for fluid or gas flow. It allows multiple inputs or outputs to be connected in a compact and organized manner.
By integrating a valve onto a manifold, you can control the flow of fluid or gas through the manifold system. The valve can be used to open, close or regulate the flow to different outlets or channels connected to the manifold.
The specific type of valve used on a manifold depends on the application and requirements. It can be a Rotary valve, Solenoid valve or any other suitable valve type based on factors such as flow rate, pressure, temperature and the type of fluid or gas being handled.
Overall, having a valve on a manifold provides convenient flow control and allows for efficient distribution or redirection of fluids or gases within a system.
(Replacement) (Patent Pending)
ParMED IERV™ PREDICTIVE FEATURES
The need for predictive maintenance components in instruments depends on various factors, including the complexity of the instrument, its criticality in the diagnostic process, and the maintenance strategy employed by the organization.
 1. Instrument Complexity: Some diagnostic instruments, especially those with sophisticated technologies and intricate mechanisms, may benefit from predictive maintenance components. These components can monitor various parameters, such as temperature, pressure, performance metrics or sensor readings to detect early signs of potential failures or malfunctions. By analyzing these data points using predictive algorithms, the instrument’s health status can be assessed and maintenance actions can be scheduled proactively.
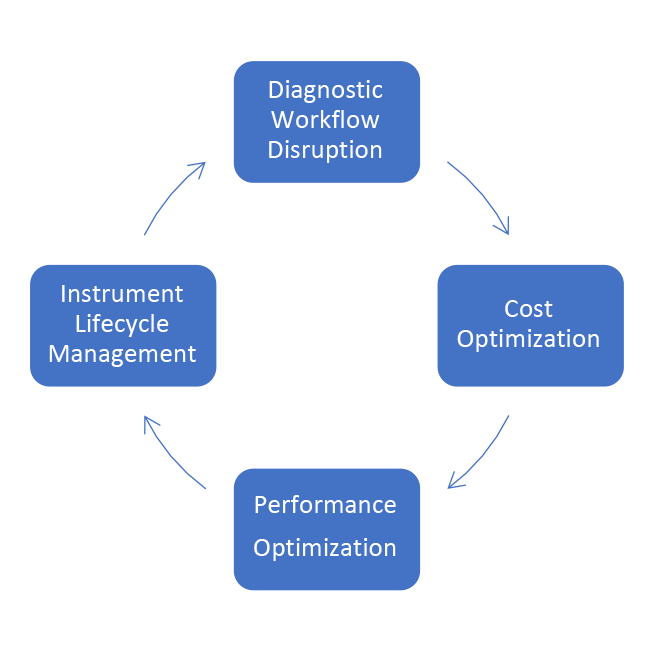
2. Diagnostic Workflow Disruption: Instruments play a crucial role in the diagnostic process, and any unexpected instrument downtime or malfunction can disrupt patient care and laboratory operations. Predictive maintenance components can help mitigate this risk by providing early warnings or alerts regarding potential failures. This allows maintenance activities to be planned in advance during scheduled downtime, reducing the likelihood of unplanned disruptions and optimizing instrument availability.
3. Cost Optimization: Traditional maintenance approaches often follow preventive or corrective maintenance schedules, which may involve routine inspections or replacing components based on fixed time intervals or usage thresholds. On the other hand, predictive maintenance focuses on the actual condition and performance of the instrument. By utilizing predictive maintenance components, organizations can optimize maintenance activities, reduce unnecessary component replacements and minimize overall maintenance costs.
4. Performance Optimization: Predictive maintenance components can provide valuable insights into the performance and reliability of diagnostic instruments. By continuously monitoring critical parameters, identifying deviations from expected performance and analyzing trends, these components can help identify potential issues before they impact the accuracy or efficiency of diagnostic testing. This allows for proactive maintenance actions, performance optimization and improved instrument reliability.
5. Instrument Lifecycle Management: Predictive maintenance components can aid in effective instrument lifecycle management. By tracking and analyzing maintenance data over time, organizations can gain insights into the instrument’s usage patterns, failure rates and optimal maintenance intervals. This information can inform decisions related to instrument replacement, upgrades or changes in maintenance strategies.
PARMED IERV™ PREDICTIVE ANALYTICS
Predictive analytics refers to the use of data, statistical algorithms and machine learning techniques to make predictions or forecasts about future events or behaviors. It involves analyzing historical data to identify patterns, relationships and trends, which can then be used to make predictions about future outcomes.
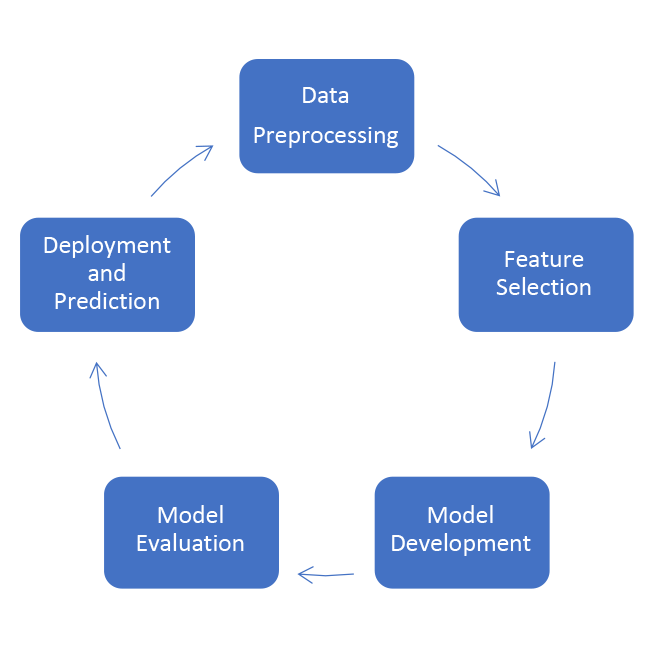 1. Data Collection: Relevant data is collected from IERV memory and sensors. The data should be comprehensive and representative of the problem or scenario being analyzed.
2. Data Preprocessing: The collected data is cleaned, transformed and prepared for analysis. This may involve tasks such as handling missing data, removing outliers or normalizing variables.
3. Feature Selection: Relevant features or variables that have a significant impact on the outcome are selected for analysis. This step helps reduce dimensionality and focuses on the most influential factors.
4. Model Development: Statistical models or machine learning algorithms are applied to the prepared data to create predictive models. These models learn from the historical data patterns and relationships to make predictions about future events.
5. Model Evaluation: The predictive models are evaluated using appropriate metrics and techniques to assess their performance and accuracy. This step helps determine the reliability and effectiveness of the models.
6. Deployment and Prediction: Once the predictive models are deemed satisfactory, they can be deployed in real-time systems or used to generate predictions for future events or behaviors. The models can be integrated into business processes or applications to support decision-making.
Predictive analytics has numerous applications across various industries. It can be used for demand forecasting, risk assessment, customer behavior analysis, predictive maintenance and many other areas where accurate predictions can provide valuable insights and help optimize decision-making.
PARMED IERV™ SPC TECHNOLOGY
SPC control stands for Statistical Process Control. It is a quality control technique used to monitor and control processes in manufacturing and other industries. SPC control involves the use of statistical methods to analyze process data and make informed decisions about process stability and performance.
 The primary objectives of SPC control are to ensure that a process is stable (i.e., it operates within a predictable range) and capable (i.e., it meets the desired specifications or requirements). By continuously monitoring and analyzing process data, SPC control helps identify any deviations or variations from the desired performance and allows for timely corrective actions.
Here are some key elements and steps involved in SPC control:
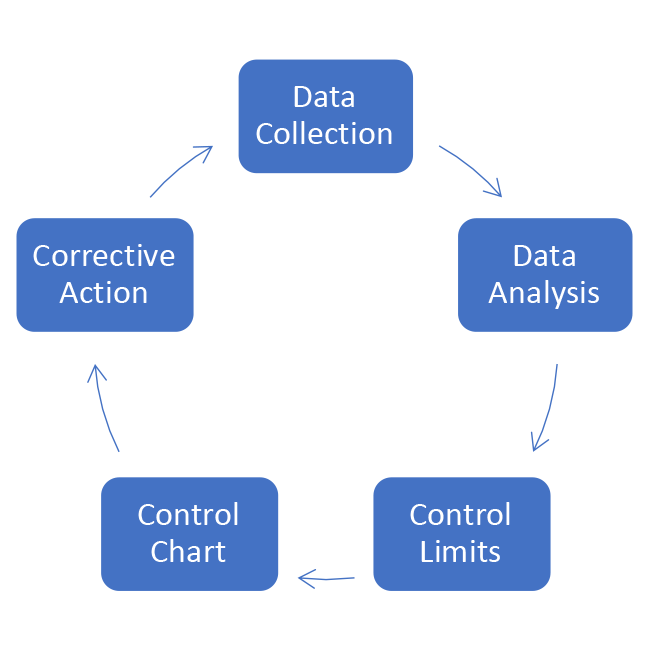
1. Data Collection: Relevant process data, such as measurements, observations or quality characteristics, are collected over time. This data can include variables (measured values) or attributes (categorical characteristics).
2. Data Analysis: Statistical techniques, such as control charts, are used to analyze the collected data. Control charts provide visual representations of process performance over time, allowing for the identification of patterns, trends and abnormal variations.
3. Control Limits: Control limits are established based on the process data. These limits define the acceptable range of variation for the process. Typically, upper and lower control limits are set based on statistical calculations or historical data.
4. Control Chart Interpretation: Process data is plotted on control charts and any data points falling outside the control limits or exhibiting unusual patterns are investigated. These points indicate potential process issues or changes that require attention.
5. Corrective Actions: When data points indicate process instability or out-of-control conditions, appropriate corrective actions are taken. These actions can involve process adjustments, investigations into the root causes of variation or process improvements to bring the process back into control.
6. Continuous Monitoring and Improvement: SPC control is an ongoing process. Process data is continuously collected, analyzed and acted upon to maintain process stability and improve performance over time.
SPC control helps organizations reduce process variability, improve product quality and minimize waste or defects. It provides a systematic approach to managing and optimizing processes, ensuring consistent and reliable output that meets customer requirements.
Advanced ParLINK™ interface software
ParLINK™ is an interface software that enables communication and interaction between the firmware and external hardware or systems. Firmware Updates are available through ParLINK™ software as we always monitor performance based on customer feedback.
ParLINK™ CAN (Controller Area Network) Communication:
- CAN is an asynchronous, multi-master, and multi-node communication protocol.
- CAN typically operates in a bus topology, multiple devices connected to the same CAN bus.
- CAN supports various data rates, including standard rates like 125 kbps, 250 kbps and 500 kbps, as well as higher-speed rates like 1 Mbps or even more in some cases.
- CAN is widely used in applications requiring robust and fault-tolerant communication over longer distances. It is known for its ability to handle high levels of electromagnetic interference and its error detection and correction mechanisms.
Multi drop valve communications.